1 Introduction
1.1 Background
1.2 Baseline
Monitoring for the Contract
1.3 Structure of the Baseline Monitoring Report
2 aIR qUALITY
2.1 Monitoring Requirement
2.2 Monitoring Locations
2.3 Monitoring Equipment
2.4 Monitoring Parameters, Frequency and Duration
2.5 Monitoring Methodology and Quality Assurance/
Quality Control (QA/QC)
2.6 24 Hour TSP Monitoring
2.7 1 Hour TSP Monitoring
2.8 Baseline Monitoring Results
2.9 Action and Limit Level
3 nOISE
3.1 Monitoring Requirement
3.2 Monitoring Locations
3.3 Monitoring Equipment
3.4 Monitoring Parameters, Frequency and Duration
3.5 Monitoring Methodology
3.6 Maintenance and Calibration
3.7 Baseline Monitoring Results
3.8 Action
and Limit Levels
4 Water quality
4.1 Monitoring
Locations
4.2 Monitoring Parameters and Frequency
4.3 Monitoring Methodology
4.4 QA/QC Requirements
4.5 Baseline Monitoring Results
4.6 Action and Limit Levels
5 Ecology
5.1 Baseline Walk-over Survey
5.2 Baseline Dolphin Monitoring
5.3 Baseline
Bored Pilling Monitoring
6 Conclusion
Figure 1.1 Contract
Layout and Location of Monitoring Stations
Figure 5.1 Updated Habitat Map after Walk Over Survey
Figure 5.2 Layout of Transect Lines of
Dolphin Monitoring in Northwest and Northeast Lantau
Areas
Figure 5.3 Location of Pak Mong Station in NE Lantau with
alignment of TM-CLKL southern connection viaduct
Figure 5.4 Fix positions of vessels (green
dots) and dolphins (purple triangle) from Pak Mong
Theodolite Tracking Station in relation to TM-CLKL alignment and HKBCF/HKLR
reclamation sites in Sep 9th �V Oct 14th 2013
Figure 5.5 Track lines of the only dolphin
group that was tracked and analyzed for movement and behavioural
patterns in the present study
Figure 5.6 Distribution of Chinese white
dolphin sightings in Northeast Lantau during January
2002 �V December 2013
Figure 5.7 Distribution of Chinese white dolphin
sightings during TM-CLKL acoustic surveys (Sep 26th �V Oct 25th
2013)
Figure 5.8 Location of the bored pile pier
sites to be monitored for the underwater noise measurement study of TM-CLKL
construction
Figure 5.9 Mean bandlevels
for the 122 recordings containing dolphin vocalizations
Figure 5.10 Mean bandlevels
for all 440 recordings as a function of time of day
Figure 5.11 Map showing the tentative
location of EAR deployments, pier sites to be monitored as well as pre-defined
route for dolphin acoustic behavioural study
Figure 5.12 The summed length of
recordings in minutes made for each day of observational effort during the
baseline acoustic monitoring in September �V October 2013
Figure 5.13 Mean number of whistles per
minute and clicks per minute recorded as a function of dolphin behavioural state
Figure 5.14 Histogram of the percentage of
EAR recordings with dolphin detections made at site C1 (Bridge Alignment Area)
during 30 days of the deployment period
Figure 5.15 The number of dolphin
encounters and the mean encounter duration for each day recorded on the EAR at
site C1 (Bridge Alignment Area)
Figure 5.16 Histogram of the percentage of
EAR recordings at site C2 (near Lung Kwu Chau), with
dolphin detections made during 30 days of the deployment period
Figure 5.17 The number of dolphin
encounters and the mean encounter duration for each day recorded on the EAR at
site C2 (near Lung Kwu Chau)
Annex A1 Calibration Certificate for Air
Quality Monitoring Equipment
Annex A2 1-hour TSP Baseline Monitoring
Results
Annex A3 Graphical Presentation of
Baseline 1-hour TSP Levels
Annex A4 24-hour TSP Baseline Monitoring
Results
Annex A5 Graphical Presentation of
Baseline 24-hour TSP Levels
Annex B1 Copies of Calibration
Certificates for Noise Monitoring Equipment
Annex B2 Day-time 07:00-19:00 hrs Baseline Noise Monitoring Data
Annex B3 Evening-time 19:00-23:00 hrs and Holidays 07:00-19:00hrs Baseline Noise Monitoring
Data
Annex B4 Night-time 23:00-07:00 hrs of the next day Baseline Noise Monitoring Data
Annex B5 Graphical Presentation of
Baseline Noise Levels
Annex C1 Copies of Calibration
Certificates for Water Quality Monitoring Equipment
Annex C2 Quality Control Report for
Laboratory Analysis
Annex C3 Baseline Water Quality Monitoring
Results
Annex C4 Graphical Presentation of
Baseline Water Quality Monitoring Data
Annex D Baseline Dolphin Monitoring Report
Prepared by Chinese White Dolphin (CWD) Service
Contract No. HY/11/02
Annex E Baseline Air Quality, Noise and
Water Quality Monitoring Schedule
Annex F Weather Conditions during Baseline
Monitoring Period
Annex G Baseline Monitoring Report for
Land-based Dolphin Behavioural and Movement
Monitoring
Annex H Baseline Monitoring Report for
Underwater Noise and Dolphin Acoustic Behavioural
Monitoring
EXECUTIVE SUMMARY
Under Contract No. HY/2012/07, Gammon Construction
Limited is commissioned by the Highways Department (HyD)
to undertake the design and construction of the Southern Connection Viaduct
Section of Tuen Mun �V Chek Lap Kok Link (TM-CLKL) (��the
Contract��). ERM-Hong Kong, Limited
(ERM) has been appointed as the Environmental Team (ET) for the Contract.
According to the requirements of the Environmental Monitoring and Audit
Manual (EM&A Manual) which is prepared for the TM-CLKL Project (Register No.: AEIAR-
146/2009), baseline monitoring has been undertaken
prior to commencement of the construction works of the Contract. This Baseline Monitoring Report presents
findings of the following baseline monitoring components:
Ÿ Air Quality;
Ÿ Noise;
Ÿ Water Quality; and
Ÿ Ecology (including baseline
walk-over survey, baseline dolphin monitoring and baseline bored piling
monitoring).
Before the commencement of the Contract, HyD employed environmental specialists under Agreement No. CE35/2011 (EP) and Contract No. HY/2011/02 to conduct baseline
environmental monitoring of air quality, noise, water quality and ecology to
facilitate early commencement of construction of Hong Kong Boundary Crossing
Facility (HKBCF) reclamation works and TM-CLKL advance Southern
Landfall reclamation works under Contract
No. HY/2010/02. The baseline environmental monitoring was
undertaken between September and November 2011 in accordance with requirements
in the EM&A Manuals for the Hong Kong Link Road (HKLR), HKBCF and TM-CLKL. A Baseline Environmental Monitoring
Report (Version C) for Hong Kong-Zhuhai-Macao Bridge Hong Kong Projects �V
Investigation (hereafter referred to as ��BEMR��) was prepared to fulfill the
Environmental Permits�� conditions for HKBCF (including TM-CLKL southern
landfall) Project ().
In the present baseline monitoring report, relevant
baseline monitoring results for air quality, noise, water quality and ecology (baseline
dolphin monitoring) presented in the BEMR have been adopted for this Contract. In addition, baseline water quality
monitoring, baseline bored piling monitoring and baseline walk-over survey have
been undertaken in the period of August to October 2013 to collect additional
baseline monitoring data for the Contract which were not covered by the 2011 baseline
monitoring.
The baseline monitoring works undertaken for air
quality, noise, water quality and ecology for the Contract are presented in Tables
1-4 below.
Air Quality
Table 1 Baseline
Air Quality Monitoring Period
|
Monitoring Stations
|
Baseline Monitoring Period
|
|
ASR 9A �V Siu Ho Wan MTRC Depot
|
18/10/2011 �V 31/10/2011
|
|
ASR 9C �V Siu Ho Wan MTRC Depot
|
During the monitoring,
there was no major dust generating activities undertaken in the vicinity of the
two monitoring stations (Table 1). Data collected were reviewed and
analyzed to determine the Action and Limit Levels for air quality which will be
used for the impact monitoring throughout the construction of the Contract. Details on the monitoring methodology,
locations and results are presented in Section
2.
Noise
Table 2 Baseline
Noise Monitoring Period
|
Monitoring Station
|
Baseline Monitoring Period
|
|
NSR 1 �V Pak Mong Village
|
18/10/2011-1/11/2011
|
Monitoring data collected was reviewed and analyzed in accordance with
requirements of the EM&A Manual.
Details on the methodology, locations and results of monitoring are
presented in Section 3 of this
report. The baseline noise
monitoring data was analyzed for the following periods:
�P
Daytime: 0700-1900
hrs on normal weekdays
�P
Evening-time: 1900-2300 hrs
�P
Holiday-time: 0700-1900 hrs on holidays
�P
Night-time: 2300-0700
hrs of next day
Water Quality
Table 3 Baseline
Water Quality Monitoring Period
|
Monitoring Stations
|
Parameters, unit
|
Baseline Monitoring Period (1)
|
|
IS(Mf)9, IS(Mf)16, IS8, SR4, CS(Mf)3, CS(Mf)5
|
Ÿ
Temperature(�XC)
Ÿ
pH(pH unit)
Ÿ
Turbidity (NTU)
Ÿ
Water depth (m)
Ÿ
Salinity (ppt)
Ÿ
Dissolved Oxygen (DO) (mg/L and % of saturation)
Ÿ
Suspended solids (SS)
(mg/L)
|
6/10/2011 �V 31/10/2011
|
|
SR4a (2)
|
29/8/2013 �V 24/9/2013
|
|
Notes:
(1) 3 days per
week, at mid-flood and mid-ebb tides, for a period of 4 weeks prior to the
commencement of the marine works)
(2) Additional baseline
water quality monitoring was undertaken at SR4a for this Contract as per
recommendation of the Environmental Review for the Temporary Staging for
Construction of the Southern Connection (ERM, 2013).
|
Details of the baseline water quality
monitoring are presented in Section 4. The collected data were used to
establish the Action and Limit Levels for Dissolved Oxygen (DO), Turbidity and Suspended
Solids (SS) for the impact monitoring throughout the construction of the Contract.
Ecology
Baseline walk-over survey was undertaken on
13 and 24 September 2013 to confirm the existing ecological conditions before
commencement of the Contract��s construction works with reference to the habitat
maps presented in the EIA Report. Findings
of the baseline walk-over survey are presented in Section 5.1.
Table 4 Baseline
Dolphin Monitoring Period
|
Date of Baseline Dolphin Monitoring
|
|
1
|
05/09/2011
|
|
2
|
07/09/2011
|
|
3
|
16/09/2011
|
|
4
|
23/09/2011
|
|
5
|
06/10/2011
|
|
6
|
10/10/2011
|
|
7
|
13/10/2011
|
|
8
|
17/10/2011
|
|
9
|
28/10/2011
|
|
10
|
01/11/2011
|
|
11
|
02/11/2011
|
|
12
|
05/11/2011
|
|
13
|
06/11/2011
|
|
14
|
07/11/2011
|
Baseline dolphin monitoring
was undertaken from September to November 2011. Details on the monitoring methodology,
locations and findings are presented in Section
5.2. Determination of Action
and Limit Levels for dolphin monitoring is also presented under the same
section.
Baseline bored piling
monitoring, including land-based theodolite tracking, underwater noise
monitoring and acoustic behavioural monitoring, were
undertaken from September to October 2013.
Details on the monitoring methodology, locations and findings are
presented in Section 5.3. Determination of Action and Limit Levels
as well as the Event Action Plan for the bored piling monitoring is also
presented under the same section.
1
Introduction
According to
the findings of the Northwest New Territories (NWNT) Traffic and Infrastructure
Review conducted by the Transport Department, Tuen Mun Road, Ting Kau Bridge, Lantau Link and North Lantau
Highway would be operating beyond capacity after 2016. This forecast has been based on the
estimated increase in cross boundary traffic, developments in the Northwest New
Territories (NWNT), and possible developments in North Lantau,
including the Airport developments, the Lantau
Logistics Park (LLP) and the Hong Kong �V Zhuhai �V Macao Bridge (HZMB). In order to cope with the anticipated
traffic demand, two new road sections between NWNT and North Lantau �V Tuen Mun
�V Chek Lap Kok Link
(TM-CLKL) and Tuen Mun
Western Bypass (TMWB) are proposed.
An
Environmental Impact Assessment (EIA) of TM-CLKL was prepared in accordance
with the EIA Study Brief (No. ESB-175/2007) and the Technical Memorandum of the Environmental
Impact Assessment Process (EIAO-TM). The EIA Report was submitted under the
Environmental Impact Assessment Ordinance (EIAO) in August 2009. Subsequent to the approval of the EIA
Report (EIAO Register Number AEIAR-145/2009), an Environmental Permit
(EP-354/2009) for TM-CLKL was granted by the Director of Environmental
Protection (DEP) on 4 November 2009, and EP variation (EP-354/2009A) was issued
on 8 December 2010.
Under
Contract No. HY/2012/07,
Gammon Construction Limited is commissioned by the Highways Department (HyD) to undertake the design and construction of the
Southern Connection Viaduct Section of TM-CLKL (��the Contract��), including the
following:
�P
A
dual 2-lane main marine crossing (Structures E2, E5, E6, E7 and E8) across the
sea between the southern landfall of TM-CLKL and NLH;
�P
Five
link or slip roads (Structures F1, F2, F3, F4 and F5) at the southern landfall
of TM-CLKL connecting a dual 2-lane rural trunk road (main marine crossing) in
(i) above with the HKBCF and the TM-CLKL Northern
Connection Sub-sea Tunnel Section;
�P
Four
link roads (Structures E1, A1, A2, B1, B2, B3,C1, C2, C3, C4, D1, D2, D3 and
D4) at North Lantau connecting the main marine
crossing in (i) above with the NLH ;
�P
Associated
civil, structural, geotechnical, marine, environmental protection, landscaping,
drainage, highway electrical and mechanical (E&M) works, street lightings,
traffic aids and sign gantries, marine navigational aids, ship impact
protection system, water mains and
fire hydrants, lightning protection system, SHMS, as well as operation and maintenance
provisions of viaducts, provisioning of facilities for installation of TCSS, provisioning
of facilities for installation of telecommunication cables/equipment and reprovisioning works of affected existing
facilities/utilities; and
�P
Incidental
works thereto the above and other associated works which are shown on the Drawings
or specified in the Contract.
Layout of the
Contract components is presented in Figure 1.1.
ERM-Hong Kong,
Limited (ERM) has been appointed as the Environmental Team (ET) for the
Contract.
The scope of the EM&A programme follows the demarcation of monitoring
responsibilities set out in Environmental Project Office��s letter dated 29.10.2013. Under the defined scope and according to relevant requirements
of the Environmental Monitoring and Audit Manual (EM&A Manual) which is
prepared for the TM-CLKL Project (Register
No.: AEIAR- 146/2009), baseline monitoring has
been undertaken prior to commencement of the construction works of the
Contract. This Baseline Monitoring
Report presents findings of the following baseline monitoring components:
Ÿ Air Quality;
Ÿ Noise;
Ÿ Water Quality; and
Ÿ Ecology (including baseline
walk-over survey, baseline dolphin monitoring and baseline bored piling
monitoring).
Before the commencement of the Contract, HyD employed environmental specialists under Agreement No. CE35/2011 (EP) and Contract No. HY/2011/02 to conduct
baseline environmental monitoring of air quality, noise, water quality and
ecology to facilitate early commencement of construction of Hong Kong Boundary
Crossing Facility (HKBCF) reclamation works and TM-CLKL advance Southern
Landfall reclamation works under Contract
No. HY/2010/02. The baseline environmental monitoring was
undertaken between September and November 2011 in accordance with requirements
in the EM&A Manuals for the Hong Kong Link Road (HKLR), HKBCF and
TM-CLKL. A Baseline Environmental
Monitoring Report (Version C) for Hong Kong-Zhuhai-Macao Bridge Hong Kong
Projects �V Investigation (hereafter referred to as ��BEMR��) was prepared to
fulfil the Environmental Permits�� conditions for HKBCF (including TM-CLKL
southern landfall) Project ().
In the present baseline
monitoring report, relevant baseline monitoring results for air quality, noise,
water quality and ecology (baseline dolphin monitoring) presented in the BEMR
have been adopted for this Contract.
In addition, baseline water quality monitoring, baseline bored piling
monitoring and baseline walk-over survey have been undertaken in the period of
August to October 2013 to collect additional baseline monitoring data for the
Contract which were not covered by the 2011 baseline monitoring. Based on findings from the 2011 and 2013
baseline monitoring, baseline levels for air quality, noise, water quality and
ecology are set out in this report for the Contract in accordance with the
EM&A Manual. These baseline
levels will be used as the basis for compliance check during the impact
monitoring in the construction of the TM-CLKL southern viaduct. Locations, schedule, methodology and
results for the baseline monitoring are also presented in this report.
Following this introductory section, the remainder of the Report is structured
as follows:
Section 2 Air
Quality �V presents the methodology and findings of the
baseline air quality monitoring.
Section 3 Noise �V presents the methodology
and findings of the baseline noise monitoring.
Section 4 Water
Quality �V presents the methodology and findings of the baseline water quality
monitoring.
Section 5 Ecology �V presents the methodology
and findings of the baseline walk-over survey, baseline dolphin monitoring as
well as baseline bored piling monitoring programme.
Section 6 Conclusion
2
aIR qUALITY
According to the EM&A Manual
of the TM-CLKL Project, baseline air quality monitoring should be carried out
for a period of not less than 14 days to collect baseline data on 1-hour and
24-hour Total Suspended Particulates (TSP) levels at all monitoring locations. Monitoring of 1-hour TSP should be
carried out at least three times per day while that of 24-hour TSP should be
conducted daily for 14 consecutive days.
Further details of the baseline air
quality monitoring are presented in the following sections.
2.2
Monitoring
Locations
Baseline air quality monitoring was conducted at two (2) monitoring
stations (ie ASR9A and ASR9C �V Siu Ho Wan MTRC Depot)
under this Contract. Locations of
the two monitoring stations, ASR9A and ASR9C, are shown in Figure 1.1.
High Volume Samplers (HVS) were used to carry
out the 24-hour TSP monitoring. Direct
reading dust meter was used to measure 1-hour average TSP levels. The 1-hour TSP level was determined
periodically by HVS to check the validity and accuracy of the results measured
by the direct reading method.
Wind data monitoring equipment was set at
Rooftop of Village Office at San Tau for logging wind speed and wind direction
such that the wind sensors are clear of obstructions or turbulence caused by
building. The wind data monitoring
equipment is recalibrated at least once every six months.
Table
2.1 summarizes the equipment used in the baseline air
quality monitoring programme. Copies of the calibration certificates
for the equipment are presented in Annex A1.
Table 2.1 Air
Quality Monitoring Equipment
|
Equipment
|
Model and Make
|
Quantity
|
|
HVS Sampler
|
GMWS 2310 c/w of TSP sampling inlet
|
9
|
|
Calibrator
|
G25A
|
1
|
|
1-hour TSP Dust Meter
|
Laser Dust Monitor �V Model LD3/3B
|
7
|
|
Wind Anemometer
|
Davis Weather Monitor II, Model no. 7440
|
1
|
Table 2.2 summarizes the monitoring parameters, monitoring period and frequency of
baseline air quality monitoring.
Table 2.2 Frequency
and Parameters of Air Quality Monitoring
|
Monitoring Station
|
Location for Measurement
|
Parameter
|
Period
|
Frequency
|
|
ASR 9A
|
Near Security Office of Siu Ho Wan MTRC Depot
|
1-hour TSP
24-hour TSP
|
0700-1900 for 1-hour TSP
24 hours for 24-hour TSP
|
3 times/ day for 1-hour TSP
Daily for 24-hour TSP
|
|
ASR 9C
|
Near Staff Canteen of Siu Ho Wan MTRC Depot
|
Weather data was recorded during the baseline
period and is shown in Annex F.
The air temperature, precipitation and the relative humidity data were obtained
from Hong Kong Observatory while wind speed and direction were recorded by the
installed Wind Anemometer. The
general weather conditions (i.e. sunny, cloudy or rainy) were recorded by the
field staff on the monitoring days.
Instrumentation
High volume Samplers (HVS) completed with
appropriate sampling inlets was employed for air quality monitoring. Each sampler was composed of a motor, a
filter holder, a flow controller and a sampling inlet and its performance
specification complies with that required by USEPA Standard Title 40, Code of
Federation Regulations Chapter 1 (Part 50).
HVS Installation
The following guidelines were adopted during
the installation of HVS:
• Sufficient support was provided to secure the
samplers against gusty wind;
• No two samplers were placed less than 2 m apart;
• The distance between the sampler and an obstacle,
such as buildings, was at least twice the height that the obstacle protrudes
above the sampler;
• A minimum of 2 m of separation from walls,
parapets and penthouses was required for rooftop samples;
• A minimum of 2 m separation from any supporting
structure, measured horizontally, was required;
• No furnaces or incineration flues were nearby;
• Airflow around the sampler was unrestricted;
• The samplers were more than 20 meters from the
drip line; and
• Any wire fence and gate used to protect the
sampler should not cause any obstruction during monitoring.
Filter Preparation
Fiberglass filters were used. These filters have a collection
efficiency of larger than 99% for particles of 0.3µm in diameter. A HOKLAS accredited laboratory, Wellab Ltd., was responsible for the preparation of 24-hr
conditioned and pre-weighed filter papers for the monitoring.
All filters were equilibrated in the
conditioning environment for 24 hours before weighing. The conditioning environment temperature
was around 25 �XC and not varied by more than ��3 �XC; the relative humidity (RH)
was <50% and not varied by more than ��5%.
Operating/ Analytical Procedures
Operating/analytical procedures for the air
quality monitoring were highlighted as follows:
Ÿ Prior to the commencement
of the dust sampling, the flow rate of the HVS was properly set (between 1.1
m3/min. and 1.4 m3/min.) in accordance with the manufacturer's instruction to
within the range recommended in USEPA Standard Title 40, CFR Part 50.
Ÿ The power supply was checked
to ensure the sampler worked properly.
Ÿ On sampling, the sampler
was operated for 5 minutes to establish thermal equilibrium before placing any
filter media at the designated air quality monitoring station.
Ÿ The filter holding frame
was then removed by loosening the four nuts and carefully a weighted and
conditioned filter was centered with the stamped number upwards, on a
supporting screen.
Ÿ The filter was aligned on
the screen so that the gasket formed an airtight seal on the outer edges of the
filter. Then the filter holding
frame was tightened to the filter holder with swing bolts. The applied pressure should be
sufficient to avoid air leakage at the edges.
Ÿ The shelter lid was closed
and secured with the aluminum strip.
Ÿ The timer was then programmed.
Information was recorded on the
record sheet, which included the starting time, the weather condition and the
filter number (the initial weight of the filter paper can be found out by using
the filter number).
Ÿ After sampling, the filter
was removed and sent to the laboratory for weighing. The elapsed time was also recorded.
Ÿ Before weighing, all
filters were equilibrated in a conditioning environment for 24 hours. The
conditioning environment temperature should be between 25�XC and 30�XC and not vary
by more than ��3�XC; the RH should be < 50% and not vary by more than ��5%. Weighing results were used for further
analysis of TSP concentrations collected by each filter.
Maintenance and Calibration
The following maintenance/calibration was
required for the HVS:
Ÿ The high volume motors and
their accessories were properly maintained. Appropriate maintenance such as
routine motor brushes replacement and electrical wiring checking were made to
ensure that the equipment and necessary power supply were in good working
condition.
Ÿ All HVS were calibrated
(five point calibration) using Calibration Kit prior to the commencement of the
baseline monitoring and thereafter at bi-monthly intervals.
Measuring Procedures
The 1-hour TSP levels were measured by the
dust meter in accordance with procedures specified in the Manufacturer��s
Instruction Manual which are described as follows:
Ÿ The 1-hour dust meter was placed
at least 1.3 m above ground.
Ÿ Set POWER to ��ON�� and make
sure that the battery level was not flash or in low level.
Ÿ Allow the instrument to
stand for about three (3) minutes with the cap of the air sampling inlet
released.
Ÿ Pushed the knob at MEASURE
position.
Ÿ Set time/mode setting to
[BG] by pushing the time setting switch. Then, started the background measurement
by pushing the start/stop switch once. It took approximately six (6) seconds to complete
the background measurement.
Ÿ Pushed the time setting
switch to change the time setting display to [MANUAL] at the bottom left of the
liquid crystal display. Finally,
pushed the start/stop switch to stop the measuring after 1 hour sampling.
Ÿ Information such as
sampling date, time, count value and site condition
were recorded during the monitoring period.
Maintenance and Calibration
For the 1-hour dust meter, it should be checked
and calibrated by HVS to determine the validity and accuracy of the results
measured by direct reading method at 2-month intervals throughout the air
quality monitoring period.
Under this Contract, baseline air quality monitoring was conducted at
two (2) monitoring stations, namely ASR 9A and ASR 9C, at the Siu Ho Wan MTRC
Depot during the period of 18 October and 2 November 2011. The detailed monitoring schedule is presented
in Annex E.
The monitoring data of
ASR 9A and ASR 9C are summarized in Tables 2.3 and 2.4. All monitoring data of 1- hour and 24-hour TSP are presented in Annexes A2 and A4, respectively.
Graphical
presentations of the 1-hour TSP and 24-hour TSP results are shown in Annex A3 and A5, respectively. Detailed weather conditions during the baseline monitoring period
are
presented in Annex F.
Table 2.3 Summary
of Baseline 1-hour TSP Monitoring Results
|
Monitoring Station
|
Average TSP Concentration (µg/m3)
(Range)
|
|
ASR 9A �V Siu Ho Wan MTRC Depot
|
222.3
(71.2-463.6)
|
|
ASR 9C �V Siu Ho Wan MTRC Depot
|
219.9
(70.2-461.8)
|
Table 2.4 Summary
of Baseline 24-hour TSP Monitoring Results
|
Monitoring Station
|
Average TSP Concentration (µg/m3)
(Range)
|
|
ASR 9A �V Siu Ho Wan MTRC Depot
|
74.1
(38.6-128.1)
|
|
ASR 9C �V Siu Ho Wan MTRC Depot
|
74.5
(45.1-113.4)
|
The weather was generally sunny and fine during the baseline monitoring period.
Road traffic dust is identified as the influencing factors which may
affect the results of
baseline monitoring.
Guidelines for establishing the Action and Limit Levels
for air quality monitoring during the construction of the Contract are
presented in Table
2.5.
Table 2.5 Guidelines
for Establishing Action and Limit Levels for Air Quality
|
Parameters
|
Action Level
|
Limit Level
|
|
1-hour TSP Level in µg/m3
|
For baseline level ≤ 384 µg/m3,
Action level = (Baseline level*1.3 + Limit level)/2
For baseline level > 384 µg/m3,
Action level = Limit level
|
500
|
|
24-hour TSP Level in µg/m3
|
For baseline level ≤ 200 µg/m3,
Action level = (Baseline level*1.3 + Limit level)/2
For baseline level > 200 µg/m3,
Action level = Limit level
|
260
|
Following the above guidelines, the Action and Limit Levels for air
quality impact monitoring are determined and presented in Tables 2.6 and 2.7.
Table 2.6 Action
and Limit Levels for 1-hour TSP
|
Location
|
Action Level, µg/m3
|
Limit Level, µg/m3
|
|
ASR 9A
|
394
|
500
|
|
ASR 9C
|
393
|
Table 2.7 Action
and Limit Levels for 24-hour TSP
|
Location
|
Action Level, µg/m3
|
Limit Level, µg/m3
|
|
ASR 9A
|
178
|
260
|
|
ASR 9C
|
Should non-compliance with the air quality criteria occur, the ET, the IEC and the SOR and the Contractor shall undertake
their specified actions in accordance with
the
Action Plan shown in Table 3.2.
Table 2.8 Event/
Action Plan for Air Quality
|
|
ACTION
|
|
EVENT
|
ET (1)
|
IEC (1)
|
SOR(1)
|
Contractor
|
|
Action Level
|
|
|
|
|
|
1. Exceedance for one
sample
|
1. Identify the source.
2. Inform the IEC and the SOR.
3. Repeat measurement to
confirm finding.
4. Increase monitoring frequency
to
daily.
|
1. Check monitoring data
submitted by the ET.
2. Check Contractor��s
working method.
|
1. Notify Contractor.
|
1. Rectify any unacceptable practice
2. Amend working methods if
appropriate
|
|
2. Exceedance for two
or more consecutive
samples
|
1. Identify the source.
2. Inform the IEC and the SOR.
3. Repeat measurements to confirm findings.
4. Increase monitoring frequency to daily.
5. Discuss with the IEC and the Contractor on
remedial actions required.
6. If exceedance
continues, arrange meeting with the IEC and the SOR.
7. If exceedance stops,
cease additional monitoring.
|
1. Check
monitoring data submitted by the ET.
2. Check
the Contractor��s working method.
3. Discuss
with the ET and the Contractor on possible remedial measures.
4. Advise
the SOR on the effectiveness of the proposed remedial measures.
5. Supervisor
implementation of remedial measures.
|
1. Confirm receipt of
notification of failure in writing.
2. Notify the Contractor.
3. Ensure remedial measures properly
implemented.
|
1. Submit proposals for remedial
actions to IEC within 3 working days of notification
2. Implement the agreed proposals
3. Amend proposal if appropriate
|
3
nOISE
According to the EM&A Manual of TM-CLKL,
baseline noise monitoring should be carried out for a period of fourteen (14)
days at all designated monitoring locations. The noise levels should be measured in
terms of A-weighted equivalent continuous sound pressure level (Leq).
Details of the baseline noise monitoring are presented in the following
sections.
Baseline noise monitoring was conducted at one (1) monitoring station,
namely NSR 1 at Pak Mong Village, under the Contract
(Figure 1.1).
3.3
Monitoring
Equipment
Integrating Sound Level Meter was used for noise monitoring. The meter is a Type 1 sound level meter
capable of giving a continuous readout of the noise level readings including
equivalent continuous sound pressure level (Leq)
and percentile sound pressure level (Lx). The meter used also complied with
International Electrotechnical Commission
Publications 651:1979 (Type 1) and 804:1985 (Type 1) specifications. The noise monitoring equipment being
used and copies of the calibration certificates for the sound level meter and
calibrator are presented in Annex B1.
In accordance with the EM&A Manual,
baseline noise for the A-weighted levels Leq,
L10 and L90 was recorded. Data obtained from the baseline noise
monitoring were processed and presented for the following periods:
�P
Daytime: 0700-1900 hrs on
normal weekdays
�P
Evening time: 1900-2300 hrs
�P
Holiday time: 0700-1900 hrs
on holidays
�P
Night time: 2300-0700 hrs
of next day
The frequency and parameters of noise
measurement are presented in Table 3.1.
Table 3.1 Frequency
and Parameters of Noise Monitoring
|
Monitoring Station
|
Location for Measurement
|
Time Period
|
Duration, min
|
Parameter
|
|
NSR 1
|
Pak Mong Village (Roof Top of Pak Mong Watch Tower)
|
Daytime on normal weekdays (0700-1900 hrs)
Evening time on all days (1900-2300 hrs) and daytime
during holidays (including Sundays) (0700-1900 hrs)
Night time on all days (2300-0700 hrs)
|
30 min
5min
|
Leq, L10 & L90
|
Façade measurement was taken at the monitoring station NSR1. Weather data was recorded
during the baseline period and is presented in Annex F. The air temperature, precipitation and
the relative humidity data were obtained from Hong Kong Observatory where the
wind speed and direction were recorded by the installed Wind Anemometer. The general weather conditions (i.e.
sunny, cloudy or rainy) were recorded by the field staff on the monitoring
days.
The monitoring procedures are as follows:
Ÿ
The microphone head of the
head level meter was normally positioned 1 m exterior of the noise sensitive
façade and lowered sufficiently so that the building��s external wall acts as a
reflecting surface.
Ÿ
For free field measurement,
the meter was positioned away from any nearby reflective surfaces. All records for free field noise levels would
be adjusted with a correction of +3 dB(A).
Ÿ
The battery condition was
checked to ensure good functioning of the meter.
Ÿ Parameters such as
frequency weighting, time weighting and measurement time were set as follows:
- frequency weighting: A
- time weighting: Fast
-
measurement
time: 5
minutes (Leq (30-min) would be
determined for daytime noise by calculating the logarithmic average of six Leq (5min) data.)
Ÿ Prior
to and after noise measurement, the meter was calibrated using the calibrator
for 94.0 dB at 1,000 Hz. If the
difference in the calibration level before and after measurement was more than
1.0 dB, the measurement was considered invalid and repeat of noise measurement
was required after re-calibration or repair of the equipment.
Ÿ Noise
monitoring was carried out continuously for 24 hours during the 14 days
baseline monitoring period. Monitoring
data were recorded and stored automatically within the sound level meter
system. At the end of the
monitoring period, noise levels in term of Leq,
L90 and L10 were recorded. In addition, site conditions and noise
sources were recorded when the equipment were checked and inspected every two
days.
Ÿ All
the monitoring data stored in the sound level meter system were downloaded
through the computer software, and all these data were checked and reviewed on computer.
Maintenance and calibration
procedures were follows:
Ÿ The
microphone head of the sound level meter and calibrator were cleaned with a
soft cloth at quarterly intervals;
Ÿ The
sound level meter and calibrator were
checked and calibrated
at yearly intervals; and
Ÿ Immediately
prior to and following each noise measurement, the accuracy of the sound level
meter should be checked using an acoustic calibrator generating known sound
pressure level at known frequency. Measurements
may be accepted as valid only if the calibration levels from before and after
the noise measurement agree to within 1.0 dB.
Baseline noise monitoring was conducted at the noise monitoring station
NSR1 in the period of 18 October and 1 November 2011 for this Contract. The monitoring schedule is shown in Annex E.
The
baseline noise monitoring results are summarized in Tables 3.2 to 3.4. All
baseline noise monitoring results are presented in Annexes B2-B4. Graphical presentations of the data are
provided in Annex B5.
Weather conditions recorded during the baseline monitoring period are
shown in Annex F.
Table 3.2 Summary
of Daytime Noise Monitoring Results (Normal Weekdays)
|
Daytime
0700-1900 hrs on
normal weekdays
|
Range
of Noise Level, dB(A)
|
|
Leq (30
min)
|
L10 (5 min)
|
L90 (5 min)
|
|
Mean
|
Max
|
Min
|
Mean
|
Max
|
Min
|
Mean
|
Max
|
Min
|
|
NSR 1
|
56.2
|
65.9
|
48.4
|
58.4
|
75.4
|
42.7
|
46.5
|
59.9
|
38.8
|
Table 3.3 Summary
of Evening-Time & Daytime (Holidays) Noise Monitoring Results
|
Evening-time
1900-2300 hrs on
all days & Daytime 0700-1900 hrs on holidays
|
Range
of Noise Level, dB(A)
|
|
Leq (30
min)
|
L10 (5 min)
|
L90 (5 min)
|
|
Mean
|
Max
|
Min
|
Mean
|
Max
|
Min
|
Mean
|
Max
|
Min
|
|
NSR 1
|
54.7
|
68.0
|
41.4
|
58.1
|
72.1
|
42.7
|
45.5
|
59.6
|
39.1
|
Table 3.4 Summary
of Night-Time Noise Monitoring Results
|
Night-time 2300-0700 hrs
of the next day
|
Range
of Noise Level, dB(A)
|
|
Leq (30
min)
|
L10 (5 min)
|
L90 (5 min)
|
|
Mean
|
Max
|
Min
|
Mean
|
Max
|
Min
|
Mean
|
Max
|
Min
|
|
NSR 1
|
50.1
|
69.1
|
37.0
|
53.0
|
73.6
|
38.4
|
42.2
|
52.0
|
35.2
|
The weather
was generally sunny and fine during the baseline monitoring periods. Insect and bird calling was noted as the
influencing factors which may affect the baseline monitoring results.
3.8
Action and Limit Levels
The Action and
Limit Levels were established in accordance with the EM&A Manual. The baseline noise level should be
referenced during the compliance check during the impact noise monitoring
period. Table 3.5 presents the Action and Limit Levels for construction
noise of the Contract. Should
non-compliance of the criteria occur, the ET, the IEC, the SOR and the
Contractor shall undertake their specified actions in accordance with the
Action Plan shown in Table 3.6.
Table 3.5 Action
Limit Levels for Noise during Construction Period
|
Time Period
|
Action Level
|
Limit Level
|
|
0700-1900 hrs on normal weekdays
|
When one
documented complaint is received
|
75* dB(A)
|
Table 3.6 Event/
Action Plan for Construction Noise
|
|
ACTION
|
|
EVENT
|
ET
|
IEC
|
SOR
|
Contractor
|
|
Action Level
|
1. Notify
the IEC and the Contractor.
2. Carry
out investigation.
3. Report
the results of investigation to the IEC and the Contractor.
4. Discuss
with the Contractor and formulate remedial measures.
5. Increase
monitoring frequency to check mitigation effectiveness.
|
1. Review
the analysed
results submitted by the ET.
2. Review
the proposed remedial measures by the Contractor and advise the SOR
accordingly.
3. Supervise
the implementation of remedial measures.
|
1. Confirm
receipt of notification of failure in writing.
2. Notify
the Contractor.
3. Require
the Contractor to propose remedial measures for the analysed noise problem.
4. Ensure
remedial measures are properly implemented.
|
1. Submit
noise mitigation proposals to IEC
2. Implement
noise mitigation proposals
|
|
Limit Level
|
1. Notify
the IEC, the SOR, the DEP and the Contractor.
2. Identify
the source.
3.
Repeat measurement to confirm findings.
4. Increase
monitoring frequency.
5. Carry
out analysis of Contractor��s working procedures to determine possible
mitigation to be implemented.
6.
Inform the IEC, the SOR and the DEP the causes & actions taken for
the exceedances.
7. Assess
effectiveness of the Contractor��s remedial actions and keep the IEC, the DEP
and the SOR informed of the results.
8. If exceedance stops, cease additional monitoring.
|
1.
Discuss amongst the SOR, the ET and the Contractor on the potential
remedial actions.
2. Review
the Contractor��s remedial actions whenever necessary to assure their effectiveness
and advise the SOR accordingly.
3. Supervise
the implementation of remedial measures.
|
1. Confirm
receipt of notification of failure in writing.
2. Notify
the Contractor.
3. Require
the Contractor to propose remedial measures for the analysed noise problem.
4. Ensure
remedial measures are properly implemented.
5. If exceedance continues, consider what activity of the work
is responsible and instruct the Contractor to stop that activity of work
until the exceedance is abated.
|
1. Take
immediate action to avoid further exceedance
2. Submit
proposals for remedial actions to IEC within 3 working days of notification
3. Implement
the agreed proposals
4. Resubmit
proposals if problem still not under control
5. Stop
the relevant activity of works as determined by the SOR until the exceedance is abated.
|
4
Water quality
According to the EM&A Manual of TM-CLKL, baseline
water quality monitoring should be carried out three (3) times per week for a
period of four (4) weeks at all the monitoring locations prior to the
commencement of marine works. The
measurement should be taken at all designated monitoring stations, including
control stations, at mid flood (within ��1.75 hour of the predicated time) and
mid-ebb (within ��1.75 hour of the predicated time) tides. Further details of the baseline water quality monitoring under this
Contract are presented in the following sections.
Baseline water
quality monitoring was conducted at seven (7) monitoring stations under the
Contract. Coordinates of the
monitoring stations are summarized in
Table 4.1. Locations of the
monitoring stations are shown in Figure 1.1.
Table 4.1 Marine
Water Quality Monitoring Locations
|
Monitoring Stations
|
Coordinates
|
|
Easting
|
Northing
|
|
IS(Mf)9
|
813273
|
818850
|
|
IS(Mf)16
|
814328
|
819497
|
|
IS8
|
814251
|
818412
|
|
SR4
|
814760
|
817867
|
|
SR4a
|
815247
|
818067
|
|
CS(Mf)3
|
809989
|
821117
|
|
CS(Mf)5
|
817990
|
821129
|
4.2
Monitoring
Parameters and Frequency
Table 4.2 summarizes the monitoring parameters, monitoring
period and frequencies of the water quality monitoring.
Table 4.2 Water
Quality Monitoring Parameters and Frequency
|
Monitoring Stations
|
Parameters, unit
|
Depth
|
Frequency
|
|
IS(Mf)9
IS(Mf)16
IS8
SR4
SR4a*
CS(Mf)3
CS(Mf)5
|
Ÿ
Temperature(�XC)
Ÿ
pH(pH unit)
Ÿ
Turbidity (NTU)
Ÿ
Water depth (m)
Ÿ
Salinity (ppt)
Ÿ
DO (mg/L and % of
saturation)
Ÿ
SS (mg/L)
|
3 water depths: 1m
below sea surface,
mid-depth and 1m
above sea bed.
|
Baseline monitoring: 3 days
per week, at mid-flood and
mid-ebb tides, for a period of
4 weeks prior to the
commencement of the marine
works
|
|
|
|
If the water depth is
less than 3m, mid-depth
sampling only.
|
|
|
|
If water depth less
than 6m, mid-depth
may be omitted.
|
|
Note: * Additional monitoring station under this Contract as per recommendation of the Environmental Review for the Temporary
Staging for Construction of the Southern Connection
(ERM, 2013)..
|
In addition to the
parameters presented in Table 4.2, monitoring
location/position, time, water depth, sampling depth, tidal stages, weather
conditions and any special phenomena or works underway nearby should also be
recorded.
Instrumentation
Table
4.3 summarizes the equipment used in the baseline water
quality monitoring works. All the
monitoring equipment complied with the requirements set out in the EM&A
Manual. Copies of the calibration
certificates are attached in Annex C1.
Table 4.3 Water
Quality Monitoring Equipment
|
Equipment
|
Model
|
Qty.
|
|
Water Sampler
|
Kahlsico Water-Bottle Model 135DW 150
|
4
|
|
Multi-parameter Water
Quality System
|
YSI 6820-C-M/YSI 6920
|
6
|
|
Dissolved Oxygen Meter
|
YSI Pro 2030
|
1
|
|
pH Meter
|
HANNA HI 8314
|
1
|
|
Turbidity Meter
|
HACH 2100Q
|
1
|
|
Monitoring Position
Equipment
|
��Magellan�� Handheld GPS
Model eXplorist GC
|
4
|
|
DGPS Koden KGP913MK2 (1)
|
1
|
|
Note:
(1) DGPS has been used for the baseline water quality
monitoring for station SR4a.
|
A multi-parameter meters (Model
YSI 6820-C-M /YSI 6920) were used to measure DO, turbidity, salinity, pH and
temperature for all monitoring stations except at SR4a.
For
water quality monitoring at SR4a, pH was measured by HANNA HI 8314, turbidity
was measured by HACH 2100Q whilst DO, salinity and temperature were measured by
YSI Pro 2030.
Operating/Analytical Procedures
At each sampling depth, two consecutive
measurements of DO level, DO saturation, salinity, turbidity, pH and
temperature were taken. The probes
were retrieved out of the water after the first measurement and then
re-deployed for the second measurement.
Where the difference in the value between the first and second readings
of each set was more than 25% of the value of the first reading, the reading
was discarded and further readings were taken. Two samples were collected for
laboratory analysis of SS content. Following collection, water samples for laboratory
analysis were stored in high density polythene bottles (250ml/1L) with no
preservatives added, packed in ice (cooled to
4�XC
without being frozen) and kept in dark during both on-site temporary storage
and shipment to the testing laboratory.
The samples were delivered to the laboratory as soon as possible and the
laboratory determination works were started within 24 hours after collection of
the water samples. Sufficient
volume of samples was collected to achieve the detection limit.
Laboratory Analytical
Methods
The testing of all parameters for all
stations except SR4a was conducted by Wellab Ltd.
(HOKLAS Registration No.083) whilst that for station SR4a was conducted by ALS Technichem (HK) Pty Ltd. (HOKLAS Registration No. 066). Comprehensive quality assurance and
control procedures were in place in order to ensure quality and consistency in
results. The testing method and
reporting limit are provided in Table 4.4.
Table 4.4 Methods
for Laboratory Analysis for Water Samples
|
Determinant
|
Instrumentation
|
Analytical Method
|
Reporting Limit
|
|
Suspended Solids (SS)
|
Weighing
|
APHA 17e 2540D
|
0.5 mg/L (1)
|
Calibration
of In Situ Instruments
All in situ monitoring
instruments were checked, calibrated and certified by a
laboratory accredited under HOKLAS or other international accreditation scheme
before use, and subsequently re-calibrated at 3 monthly intervals throughout
all stages of the water quality monitoring programme. Responses of sensors and electrodes were
checked with certified standard solutions before each use. Wet bulb calibration for a DO meter was
carried out before measurement at each monitoring event.
For the on
site calibration of field equipment (Multi-parameter Water Quality
System), the BS 1427:2009, "Guide to on-site test methods for the analysis
of waters" was observed.
Sufficient stocks of spare
parts were maintained for replacements when necessary. Backup monitoring equipment was also
being made available so that monitoring can proceed uninterrupted even when
some equipment was under maintenance, calibration, etc.
Decontamination Procedures
Water sampling equipment used during the
course of the monitoring programme was decontaminated
by manual washing and rinsed clean seawater/distilled water after each sampling
event. All disposal equipment was
discarded after sampling.
Sampling Management and Supervision
All sampling bottles were labeled with the
sample I.D (including the indication of sampling station and tidal stage e.g.
IS1_me_a), laboratory number and sampling date. Water samples were dispatched to the
testing laboratory for analysis as soon as possible after the sampling. All
samples were stored in a cool box and kept at less than 4�XC but without
frozen. All water samples were
handled under chain of custody protocols and relinquished to the laboratory
representatives at locations specified by the laboratory. The laboratory determination works were
started within 24 hours after collection of water samples.
Quality Control Measures for Sample Testing
The samples testing were performed by Wellab Ltd. and ALS Technichem (HK)
Pty Ltd. The following quality
control programme was performed by the laboratories
for every batch of 20 samples:
Ÿ One method blank; and
Ÿ One set of quality control
(QC) samples (including method QC and sample duplicate).
The QA/QC results are attached
in Annex C2.
Baseline water quality monitoring was
conducted between 6 and 31 October 2011 for all monitoring stations, except for
station SR4a for which monitoring was conducted between 29 August and 24
September 2013. The monitoring
results are shown in Annex C3. Graphical presentation of water quality
at the monitoring stations is given in Annex C4.
Detailed weather conditions at the monitoring locations during the
baseline monitoring period are shown in Annex F. The monitoring schedule is shown in Annex E.
During the baseline monitoring period, no
marine construction works were observed in the vicinity of all monitoring
stations. The baseline monitoring
results are thus considered representative of the ambient water quality.
The Action and Limit Levels for DO, SS and turbidity are determined in accordance
with requirements set out in the EM&A Manual which are summarized in Table 4.5.
Table 4.5 Action
and Limit Levels for Water Quality
|
Parameter (unit)
|
Water Depth
|
Action Level
|
Limit Level
|
|
Dissolved Oxygen (mg/L) (surface, middle and bottom
|
Surface and Middle
|
5%-ile of baseline data
|
4mg/L except 5mg/l for FCZ or 1%-ile of
baseline data
|
|
Bottom
|
5%-ile of baseline data
|
2mg/L or 1%-ile of baseline data
|
|
Turbidity (NTU)
|
Depth average
|
95%-ile of
baseline data and 120% of upstream control station��s turbidity at the same
tide of the
same day
|
99%-ile of
baseline and 130% of turbidity at the upstream control
station at the same tide of same day
|
|
SS (mg/L)
|
Depth average
|
95%-ile of
baseline data and 120% of upstream control station��s SS at the
same tide of the same day
|
99%-ile of
baseline and 130% of SS at the upstream control station at the same tide of
same day
|
|
Notes:
(1) Depth-averaged is
calculated by taking the arithmetic means of reading of all three depths
(2) For DO, non-compliance
of the water quality limit occurs when monitoring result is lower that the
limit.
(3) For SS & turbidity
non-compliance of the water quality limits occur when monitoring result is
higher than the limits.
|
The calculated Action and Limit levels are shown in Table 4.6.
Table 4.6 Action
and Limit Levels for Water Quality
|
Parameter (unit)
|
Water Depth
|
Action Level
|
Limit Level
|
|
Dissolved Oxygen (mg/L) (surface, middle and bottom
|
Surface and Middle
|
5.0
|
4.2 except 5 for FCZ
|
|
|
Bottom
|
4.7
|
3.6
|
|
Turbidity (NTU)
|
Depth average
|
27.5 and 120% of upstream control station��s
turbidity at the same tide of the
same day
|
47.0 and 130% of turbidity at the upstream
control
station at the same tide of same day
|
|
SS (mg/L)
|
Depth average
|
23.5 and 120% of upstream control station��s
SS at the
same tide of the same day
|
34.4 and 130% of SS at the upstream control
station at the same tide of same day
|
|
Notes:
(1) Depth-averaged is calculated
by taking the arithmetic means of reading of all three depths
(2) For DO, non-compliance
of the water quality limit occurs when monitoring result is lower that the
limit.
(3) For SS & turbidity
non-compliance of the water quality limits occur when monitoring result is
higher than the limits.
|
Table 4.7 Event/
Action Plan for Water Quality
|
Event
|
ET Leader
|
IEC
|
SOR
|
Contractor
|
|
Action level being exceeded by one sampling day
|
Repeat in situ measurement on
next day of exceedance to confirm findings;
Identify source(s) of impact;
Inform IEC, contractor and SOR;
Check monitoring data, all plant,
equipment and Contractor's
working methods.
|
Check monitoring data
submitted by ET and
Contractor��s working methods.
|
Confirm receipt of notification of non-compliance
in writing;
Notify Contractor.
|
Inform the SOR and confirm
notification of the non-compliance
in writing;
Rectify unacceptable practice;
Amend working methods if appropriate.
|
|
Action level being exceeded by two or more consecutive
sampling days
|
Repeat measurement on next day
of
exceedance to confirm findings;
Identify source(s) of impact;
Inform IEC, contractor, SOR and EPD;
Check monitoring data, all plant,
equipment and Contractor's
working methods;
Discuss mitigation measures with IEC, SOR and Contractor;
Ensure mitigation measures are implemented;
Increase the monitoring
frequency to daily until no
exceedance of Action level;
|
Check monitoring data
submitted by ET and
Contractor��s working method;
Discuss with ET and Contractor
on
possible remedial actions;
Review the proposed mitigation
measures submitted by
Contractor and advise the SOR accordingly;
Supervise the implementation of mitigation measures.
|
Discuss with IEC on the proposed mitigation measures;
Ensure mitigation measures are
properly implemented;
Assess the effectiveness of the
implemented mitigation measures.
|
Inform the Supervising
Officer and confirm notification of the non-compliance in writing;
Rectify unacceptable practice;
Check all plant and equipment and
consider changes of working methods;
Submit proposal of additional
mitigation measures to SOR within 3 working days of notification and discuss with ET, IEC and SOR;
Implement the agreed mitigation measures.
|
|
Limit level being exceeded by one sampling day
|
Repeat measurement on next day
of
exceedance to confirm findings;
Identify source(s) of impact;
Inform IEC, contractor, SOR and EPD;
Check monitoring data, all plant,
equipment and Contractor's
working methods;
Discuss mitigation measures with
IEC, SOR and Contractor;
|
Check monitoring data
submitted by ET and
Contractor��s working method;
Discuss with ET and Contractor
on
possible remedial actions;
Review the proposed mitigation
measures submitted by
Contractor and advise the SOR accordingly.
|
Confirm receipt of notification of failure in writing;
Discuss with IEC, ET and Contractor on the proposed mitigation measures;
Request Contractor to review the working methods.
|
Inform the SOR and confirm
notification of the non-compliance
in writing;
Rectify unacceptable practice;
Check all plant and equipment and
consider changes of working methods;
Submit proposal of mitigation
measures to SOR within 3 working days
of
notification and discuss with ET,
IEC and SOR.
|
|
Limit level being exceeded by two or more consecutive
sampling days
|
Repeat measurement on next day
of
exceedance to confirm findings;
Identify source(s) of impact;
Inform IEC, contractor, SOR and EPD;
Check monitoring data, all plant, equipment and Contractor's
working methods;
Discuss mitigation measures
with IEC, SOR and Contractor;
Ensure mitigation measures are
implemented;
Increase the monitoring
frequency to daily until no
exceedance of Limit level for
two consecutive days;
|
Check monitoring data
submitted by ET and
Contractor��s working method;
Discuss with ET and Contractor
on
possible remedial actions;
Review the Contractor��s
mitigation measures whenever necessary to assure their
effectiveness and advise the SOR accordingly;
Supervise the implementation of
mitigation measures.
|
Ensure mitigation measures are
properly implemented;
Consider and instruct, if necessary, the Contractor to slow down or to
stop all or part of the construction activities until no exceedance of Limit level.
|
Take immediate action to avoid
further exceedance;
Submit proposal of mitigation
measures to SOR within 3 working days
of
notification and discuss with ET,
IEC and SOR;
Implement the agreed mitigation measures;
Resubmit proposals of mitigation
measures if problem
still not under
control;
As directed
by the Supervising
Officer, to slow down or to stop all or part of the construction activities until no
exceedance of Limit level.
|
5
Ecology
Baseline
walk-over survey was carried out in September 2013 to confirm the existing
ecological conditions with reference to the habitat maps presented in the approved
EIA Report of the Project. In
accordance with requirements of the EM&A Manual, no
detailed ecological surveys of flora and fauna were undertaken for the baseline
walk-over survey.
5.1.1
Observations
With
reference to the habitat categorization in the approved EIA report, habitats
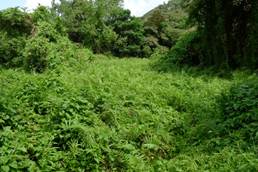
were classified into following ten (10) types (please also refer to Table 5.1):
Mixed Woodland
In
this walk over survey mixed woodland refer to both secondary woodland and
mature plantation woodland with reasonable proportion of native species and
typical woodland flora profile.
Tall Shrubland
Tall shrubland habitat is densely
populated with a mix of native tree and shrubby plant species.
Shrubby Grassland
The shrubby grassland is dominated by herbaceous ferns and grass
with shrubs and tree species that are patchily distributed on the hill-slopes
within the Study area.
Salt Marsh
Salt Marsh is those low-lying wet land that is influenced by
saltwater.
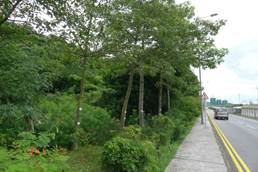
Plantation
In
this walk over survey, plantation refers to artificial planting area which
included man-made slope and roadside plantation for landscape and ornamental
use.
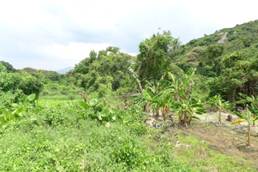
Cultivated Field
Cultivated field includes both active, inactive cultivation fields
and orchards.
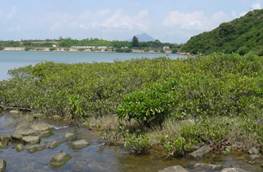
Mangrove
Mangrove
refers to coastal vegetation which dominated by mangrove and mangrove
associated species.
Wasteland
Wasteland
is an open field which has dominated by weeds and pioneer species.
Watercourse
Watercourse
included both natural stream and modified stream.
Developed Area
Typical
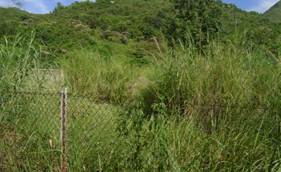
developed areas within the Study area are the Airport Railway Deport, North Lantau Highway and Pak Mong Village.
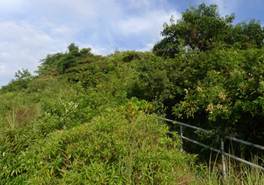
Table 5.1 Types
of Habitats observed in Walk-over Survey
|
Mixed Woodland
|
Tall Shrubland
|
|

|
|
|
Shrubby Grassland
|
Salt Marsh
|
|

|
|
|
Plantation
|
Cultivated Field
|
|
|
|
|
Mangrove
|
Wasteland
|
|
|
|
|
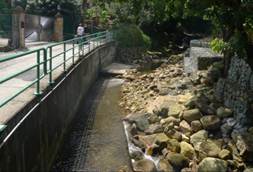
Watercourse
|
Developed Area
|
|
|

|
5.1.2
Results
Habitats within Study Area
The
updated habitat map is presented in Figure 5.1. Larger area of tall shrubland
was identified within the Study area.
It is believed that they are developed from previous shrubby grassland
identified in approved EIA.
Woodland behind Pak Mong Village was defined as plantation woodland in
previous EIA. In this walk-over
survey, both mature native species and fruit tree species are well developed
into typical woodland profile.
Therefore, it is now classified as mixed woodland. Some of the orchard area and farmland
are now invaded by self-seeded plant indicating its inactive status. However, according the approved EIA
report both inactive and active are categorized as cultivated land. Thus only those believed to be abandoned
and developed into a stage that can fit the description of another types of
habitat mentioned above will be shown in the updated habitat map.
It
should be noted that mangrove area increased along the inner bay of Tai Ho Wan.
Habitats within Project Area
Habitat
types within the Project area are similar to the approved EIA report except
some of the man-made slope and landscape area that previously defined as
developed area are now classified as plantation because of its vegetation
coverage and maturity of development.
Flora Species of
Conservation Interest
This
walk-over survey also confirmed the existence of the flora species of
conservation interest according to the figure ��Location of Species of
Conservation Interest Recorded in North Lantau
between 2003 to 2009�� in approved EIA report. Most of them can be found within the Study
area except those grown in some inaccessible area (e.g. fence off area).
Baseline
dolphin monitoring was undertaken at Northwest Lantau (NWL) and Northeast Lantau
(NEL) under the Chinese White
Dolphin (CWD)
Service Contract No. HY/2011/02 for a period
of three months prior to the commencement of the
Contract. The baseline line-transect vessel surveys for dolphin monitoring were conducted in September,
October and November 2011 as shown in Table
5.2. Location of
dolphin transect survey is presented in Figure 5.2. Detailed monitoring results are
presented in Annex D.
Table 5.2 Date
of Baseline Dolphin Monitoring
|
No.
|
Date
|
Location
|
|
1
|
05/09/2011
|
W LANTAU + NW LANTAU
|
|
2
|
07/09/2011
|
NW LANTAU + NE LANTAU
|
|
3
|
16/09/2011
|
NW LANTAU + NE LANTAU
|
|
4
|
23/09/2011
|
W LANTAU + NW LANTAU
|
|
5
|
06/10/2011
|
NE LANTAU + NW LANTAU
|
|
6
|
10/10/2011
|
NW LANTAU +NE LANTAU
|
|
7
|
13/10/2011
|
NE LANTAU
|
|
8
|
17/10/2011
|
W LANTAU + NW LANTAU
|
|
9
|
28/10/2011
|
NW LANTAU + W LANTAU
|
|
10
|
01/11/2011
|
NW LANTAU +NE LANTAU
|
|
11
|
02/11/2011
|
W LANTAU + NE LANTAU
|
|
12
|
05/11/2011
|
NW LANTAU + NE LANTAU
|
|
13
|
06/11/2011
|
NE LANTAU
|
|
14
|
07/11/2011
|
NW LANTAU + W LANTAU
|
|
Notes:
* NW Lantau = Northwest Lantau Survey Area, NE Lantau = Northeast Lantau Survey Area, W Lantau = West Lantau
|
In total, 112 groups of Chinese White Dolphins,
numbering 413 individuals, were observed during the three-month survey. Most of them were sighted in the West Lantau (WL) and Northwest Lantau
(NWL) regions.
Major findings along and near the future alignments of
HKLR and TM-CLKL as well as the reclamation site of HKBCF (collectively called
��the Site�� below) are summarized as follows:
Ÿ Dolphins were sighted but
not in high concentration near the Site;
Ÿ Several large dolphin
aggregations were seen near the Site;
Ÿ Several grids had moderate
to high dolphin density near the Site;
Ÿ Several mother-calf pairs
were recorded (near alignments of HKLR and TM-CLKL only);
Ÿ Several feeding activities
were sighted along and near the Site; and
Ÿ Two fishing boat-associated
sightings were made near the Site.
Through photo-identification work, 96 individuals were
identified from 182 sightings. Some
were sighted over three times during the three-month survey, indicating their
frequent use of Hong Kong waters. Many
of them were year-round residents and some were accompanied by calves. Ranging pattern developed showed that
most of the dolphins ranged across the three survey areas including the HZMB
work areas.
5.2.1
Determination of Action and
Limit Levels for Dolphin Monitoring
Vessel-based Line-transect Survey Methodology
According
to the requirement of the EM&A Manual, dolphin monitoring programme should cover all transect lines in NEL and NWL
survey areas twice per month throughout the entire construction period.
The
survey team used standard line-transect methods (Buckland et al. 2001) to conduct the systematic vessel surveys. For each monitoring vessel survey, a
15-m inboard vessel (Standard 31516)
with an open upper deck (about 4.5 m above water surface) will be used to make
observations from the flying bridge area.
Two
experienced observers (a data recorder and a primary observer) made up the
on-effort survey team, and the survey vessel will transit different transect
lines at a constant speed of 13-15 km per hour. The data recorder will search with
unaided eyes and fill out the datasheets, while the primary observer will search
for Chinese white dolphins continuously through 7 x 50 marine binoculars. Both observers will search the sea ahead
of the vessel, between 270o and 90o (in relation to the
bow, which is defined as 0o).
One to two additional experienced observers will be available on the
boat to work in shift (i.e. rotate every 30 minutes) in order to minimize
fatigue of the survey team members.
During
on-effort survey periods, the survey team will record effort data including
time, position (latitude and longitude), weather conditions (Beaufort sea state
and visibility), and distance traveled in each series (a continuous period of
search effort) with the assistance of a handheld GPS (Garmin eTrex Legend).
Data
including time, position and vessel speed will also automatically and
continuously be logged by handheld GPS throughout the entire survey for
subsequent review.
When
dolphins are sighted, the survey team will end the survey effort, and
immediately record the initial sighting distance and angle of the dolphin group
from the survey vessel, as well as the sighting time and position. Then the research vessel will be diverted
from its course to approach the animals for species identification, group size
estimation, assessment of group composition, and behavioural
observations. The perpendicular
distance (PSD) of the dolphin group to the transect line will be later
calculated from the initial sighting distance and angle.
Survey
effort being conducted along the parallel transect lines that are perpendicular
to the coastlines will be labeled as ��primary�� survey effort, while the survey
effort conducted along the connecting lines between parallel lines will be labeled
as ��secondary�� survey effort.
Data Analysis (Dolphin Encounter Rate)
Encounter
rates of Chinese white dolphins (number of on-effort sightings per 100 km of
survey effort, and total number of dolphins sighted on-effort per 100 km of survey
effort) will be calculated in NEL and NWL survey areas in relation to the
amount of survey effort conducted during each month of monitoring survey. Dolphin encounter rates will be calculated
for comparison between the baseline monitoring and impact monitoring results
For
the HZMB baseline monitoring results, the encounter rates were calculated using
primary survey effort alone (i.e. effort conducted along parallel transect
lines that were perpendicular to the coastlines). Only data collected under Beaufort 3 or
below condition would be used for encounter rate analysis. The average encounter rate of sightings
(STG) and average encounter rate of dolphins (ANI) were deduced based on the
encounter rates from six events during the baseline period (i.e. six sets of
line-transect surveys in North Lantau) using the
following formulae:
Total No. of On-effort
Sightings
Encounter
Rate (STG) = ---------------------------------------------------- x
100
Total Amount of Survey Effort (km)
Total No. of Dolphins
from All On-effort Sightings
Encounter
Rate (ANI) =
-------------------------------------------------------------------- x 100
Total Amount of Survey Effort (km)
These
encounter rates will be used for the implementation of Event and Action Plan to
examine whether the Action Level or Limit Level should be triggered from the
comparison of encounter rates between baseline and impact phase quarterly
monitoring periods.
Dolphin Encounter Rates during Baseline
Period
During
the present three-month study period, the encounter rates of Chinese White
Dolphins deduced from the survey effort and on-effort sighting data from the
primary transect lines under favourable conditions (Beaufort 3 or below) from
each of the survey areas are shown in Table
5.3.
Table 5.3 Dolphin
Encounter Rates (Sightings Per 100 km of Survey
Effort) during the Baseline Monitoring Period (September - November 2011)
|
Survey Area
|
Dolphin Monitoring
|
Encounter rate (STG)
(no. of on-effort dolphin sightings per 100 km of survey effort)
|
Encounter rate (ANI)
(no. of dolphins from all on-effort sightings per 100 km of survey effort)
|
|
Primary Lines Only
|
Primary Lines Only
|
|
Northeast Lantau
|
Set 1
|
3.34
|
3.34
|
|
Set 2
|
0.00
|
0.00
|
|
Set 3
|
3.02
|
15.11
|
|
Set 4
|
5.92
|
14.79
|
|
Set 5
|
13.76
|
73.39
|
|
Set 6
|
9.93
|
26.49
|
|
Average from the six sets
|
6.00 �� 5.05
|
22.19 �� 26.81
|
|
Northwest Lantau
|
Set 1
|
1.39
|
2.77
|
|
Set 2
|
16.57
|
55.25
|
|
Set 3
|
5.24
|
24.48
|
|
Set 4
|
8.45
|
35.47
|
|
Set 5
|
13.13
|
86.30
|
|
Set 6
|
14.33
|
83.69
|
|
Average from the six sets
|
9.85 �� 5.85
|
44.66 �� 29.85
|
Event
and Action Plan for Dolphin Impact Monitoring
To
define the Action Level (AL) and Limit Level (LL) in comparison with the
baseline dolphin encounter rate, the seasonal fluctuation of dolphin encounter
rate in NWL and NEL were considered by comparing dolphin encounter rates across
the four seasons in order to take the natural fluctuation of dolphin occurrence
into account.
Notably,
the natural fluctuation among different seasons can differ by as much as 30%,
and in a few extreme cases up to 40-60% upon review of dolphin historical data
in North Lantau waters.
Therefore,
the approach of 30% and 60% percentage reduction to define the AL and LL,
respectively, is reasonable to determine whether the construction activities of
TM-CLKL project have caused real significant impact on dolphin occurrence,
instead of triggering false alarms prematurely. Although the exact percentages (30%/60%)
for the AL and LL are set somewhat arbitrarily, this is based on careful
consideration of the natural fluctuation of dolphin occurrences among different
seasons as explained above.
The
proposed AL and LL are shown in Tables 5.4
and 5.5:
Table 5.4 Action
Level and Limit Level for Dolphin Impact Monitoring
|
|
North Lantau
Social Cluster
|
|
|
NEL
|
NWL
|
|
Action Level
|
STG
< 70% of baseline &
ANI < 70% of baseline
|
STG
< 70% of baseline &
ANI < 70% of baseline
|
|
Limit Level
|
STG
< 40% of baseline &
ANI < 40% of baseline
|
STG
< 40% of baseline &
ANI < 40% of baseline
|
|
Notes:
1.
STG
means quarterly encounter rate of number of dolphin sightings, which is 6.00
in NEL and 9.85 in NWL during the baseline monitoring period
2.
ANI
means quarterly encounter rate of total number of dolphins, which is 22.19
in NEL and 44.66 in NWL during the baseline monitoring period
3.
AL
will be trigger if either NEL or NWL fall below the criteria; LL will be
triggered if both NEL and NWL fall below the criteria.
|
Table 5.5 Derived
Value of Action Level (AL) and Limit Level (LL)
|
|
North Lantau
Social Cluster
|
|
|
NEL
|
NWL
|
|
Action Level
|
STG < 4.2
& ANI< 15.5
|
STG < 6.9
& ANI < 31.3
|
|
Limit Level
|
STG < 2.4
& ANI <8.9
|
STG < 3.9
& ANI <17.9
|
|
Notes:
1.
AL
will be trigger if either NEL or NWL fall below the criteria; LL will be
triggered if both NEL and NWL fall below the criteria.
|
Should non-compliance of the criteria occur, action in accordance with
the Event and Action Plan, as provided in Table
5.6 should be carried out.
Table 5.6 Implementation
of Event-Action Plan for Dolphin Monitoring
|
Event
|
ET Leader
|
IEC
|
SOR
|
Contractor
|
|
Action Level
|
1.
Repeat statistical data analysis to confirm findings;
2.
Review all available and relevant data, including raw data
and statistical analysis results of other parameters covered in the EM&A,
to ascertain if differences are as a result of natural variation or
previously observed seasonal differences;
3.
Identify source(s) of impact;
4.
Inform the IEC, SOR and Contractor;
5.
Check monitoring data.
6.
Review to ensure all the dolphin protective measures are
fully and properly implemented and advise on additional measures if
necessary.
|
1. Check monitoring data
submitted by ET and Contractor;
2. Discuss monitoring results
and findings with the ET and the Contractor.
|
1.
Discuss monitoring with the IEC and any other measures
proposed by the ET;
2.
If SOR is satisfied with the proposal of any other
measures, SOR to signify the agreement in writing on the measures to be
implemented.
|
1. Inform the SOR and confirm notification
of the non-compliance in writing;
2. Discuss with the ET and
the IEC and propose measures to the IEC and the SOR;
3. Implement the agreed
measures.
|
|
Limit Level
|
1.
Repeat statistical data analysis to confirm findings;
2.
Review all available and relevant data, including raw data
and statistical analysis results of other parameters covered in the EM&A,
to ascertain if differences are as a result of natural variation or
previously observed seasonal differences;
3.
Identify source(s) of impact;
4.
Inform the IEC, ER/SOR and Contractor of findings;
5.
Check monitoring data;
6.
Repeat review to ensure all the dolphin protective measures
are fully and properly implemented and advise on additional measures if
necessary;
7.
If ET proves that the source of impact is caused by any of
the construction activity by the works contract, ET to arrange a meeting to
discuss with IEC, ER/SOR and Contractor the necessity of additional dolphin
monitoring and/or any other potential mitigation measures (e.g., consider to
modify the perimeter silt curtain or consider to control/temporarily stop
relevant construction activity etc.) and submit to IEC a proposal of
additional dolphin monitoring and/or mitigation measures where necessary.
|
1. Check monitoring data
submitted by ET and Contractor;
2. Discuss monitoring results
and findings with the ET and the Contractor;
3. Attend the meeting to
discuss with ET, ER/SOR and Contractor the necessity of additional dolphin
monitoring and any other potential mitigation measures;
4. Review proposals for
additional monitoring and any other mitigation measures submitted by ET and
Contractor and advise ER/SOR of the results and findings accordingly;
5. Supervise / Audit the implementation of
additional monitoring and/or any other mitigation measures and advise ER/SOR
the results and findings accordingly.
|
1.
Attend the meeting to discuss with ET, IEC and Contractor
the necessity of additional dolphin monitoring and any other potential
mitigation measures;
2.
If ER/SOR is satisfied with the proposals for additional
dolphin monitoring and/or any other mitigation measures submitted by ET and
Contractor and verified by IEC, ER/SOR to signify the
agreement in writing on such proposals and any other mitigation measures;
3. Supervise the
implementation of additional monitoring and/or any other mitigation measures.
|
1. Inform the ER/SOR and confirm notification
of the non- compliance in writing;
2. Attend the meeting to
discuss with ET, IEC and ER/SOR the necessity of additional dolphin
monitoring and any other potential mitigation measures;
3. Jointly submit with ET to
IEC a proposal of additional dolphin monitoring and/or any other mitigation
measures when necessary;
4. Implement the agreed
additional dolphin monitoring and/or any other mitigation measures.
|
In accordance
with the EM&A Manual, baseline bored piling monitoring comprising
land-based theodolite tracking, underwater noise monitoring and acoustic behavioural monitoring were undertaken in September and October
2013 before commencement of construction of the Contract. Findings of the baseline bored pilling
monitoring are presented in the following sections.
5.3.1
Land-Based Theodolite Tracking
The objective
of the land-based theodolite tracking is to monitor the movement and behaviour of Chinese White Dolphins near the bored piling works
before, during and after the works in order to record and note any changes in
response to the bored piling noise.
Detailed methodology, results and discussion of the baseline land-based
theodolite tracking which is undertaken before commencement of construction
under the Contract is presented in Annex G. Key findings are presented below.
Survey
Location and Efforts
A total of 186
hours and 28 minutes were spent during the 30 days of effort from 9 September to
14 October 2013 for the baseline land-based theodolite tracking. Dolphins were successfully tracked from the
land-based station on 2 of 30 days of effort, and a total of three (3) dolphin
groups were tracked. A total of
3,053 vessels of 16 different types were tracked with the majority being
transportation vessels.
Location
of the Pak Mong Station where monitoring was
undertaken is provided in Figure 5.3.
Key
Findings
Amongst the
three dolphin tracks recorded during the baseline monitoring, only one met the
conditions for analysis (please refer to Annex G for details on
methodology of data analysis). This
group was tracked for 47 minutes and 37 seconds near Siu Ho Wan (ie approximately 1.5-2.0 km from the alignment of the
Southern Connection Viaduct Section; Figures 5.4 and 5.5), during which three (3) vessels approached within
500 meters (fishing boat = 1, dumping guide boats = 2). A maximum of one (1) boat was present at
any time, for a total of 10 minutes of interaction time for all three boats. The mean speed of the dolphin group over
the duration of the track was 9.02 km/hr,
reorientation rate was 156.1 ˚/surfacing, linearity was 0.010, and inter-breath
interval was 99 seconds.
Notably, the
single track analysed for the present Study was located
near Siu Ho Wan and Shum Shui Kok,
at least 2km from the Pak Mong Station and at a
distance from the Southern Connection Viaduct Section. Therefore, the movement pattern of
dolphins at this great distance away from the potential impact area may not provide
indicative information to establish the baseline condition for the EM&A programme.
From the
results presented here, it is clear that the Study area is not frequently used
by dolphins even before commencement of construction of the Southern Connection
Viaduct Section. In fact, there are
multiple lines of evidence to support that dolphins rarely occur in the area
near the Southern Connection Viaduct Section in the past and present:
l
Review of Hong
Kong Cetacean Research Project (HKCRP) long-term monitoring data on
Chinese White Dolphins indicated that very few dolphins have occurred in this
area in the past. Out of the 927
dolphin sightings made in NEL during 2002-2013, fewer than 10 groups were
sighted in the proximity to the Southern Connection Viaduct Section (Figure 5.6).
l
Under the same bored piling monitoring programme for the TM-CLKL, concurrent intensive surveys
were conducted to examine dolphin acoustic behaviour
in NEL area between 26 September and 25 October 2013. Despite a large amount of search effort
spent in this area during the 30-day period, no dolphin was sighted in the
proximity to the TM-CLKL alignment at all, and most dolphin sightings were made
in the northern portion of the survey area (Figure 5.7).
l
For the same bored piling monitoring programme, passive acoustic monitoring was also conducted
to detect dolphin presence 24 hours a day, by deploying an Ecological Acoustic
Recorder (EAR) adjacent to the bridge alignment from 27 September to 26 October
2013. Results indicated that
dolphin acoustic activity near the TM-CLKL alignment was much lower than a
control site near Lung Kwu Chau. The Study concluded that the lack of
dolphin whistles recorded and the sparse detections of clicks was an indicator
that the area near the TM-CLKL alignment was likely not used very much for
socializing or regular foraging by the dolphins.
In summary,
dolphins rarely occur along or near the Southern Connection Viaduct Section in
the past and present. This may be
related to the high level of human activity, but more likely is driven by other
factors such as the absence of prey, or the shallowness of seabed in this
area. If this area has a naturally
low density of dolphins, then the overall effect of construction activities on
dolphins is likely to be low, which confirm the prediction from the original
EIA study for the TM-CLKL Project.
Variation
to the Event and Action Plan
According to Section 6.5 of the EM&A Manual, the
Action and Limit Levels as well as the Event and Action Plan for ecology should
be proposed using the baseline monitoring data. The response variables for dolphin
movement patterns (ie mean leg speed, mean
inter-breath interval, reorientation rate and linearity) and dolphin behaviour (five different behavioural
states) should be assessed under the Event and Action Plan, and these variables
should be recorded during both baseline and construction phase monitoring
works. Departures of any of these
variables between baseline and construction phases by a certain percentage of
difference would trigger the Action and Limit Levels.
However, due
to the paucity of dolphin sightings and the availability of a single track for
analysis from the present 30-day land-based theodolite tracking works, it is
impossible to reliably establish the baseline values for the various response
variables. In addition, as dolphins
rarely occur in this area as discussed above, it is expected that such rare
occurrence of dolphins would persist during the construction phase of the Contract. Without appropriate baseline information
established for the behaviour and movement of Chinese
White Dolphins, it is decided that any Event and Action Plan cannot be properly
implemented for the land-based theodolite tracking during impact monitoring,
and therefore it would rely on the implementation of Event and Action Plan on
dolphin acoustic behaviour to monitor/safeguard
dolphins from the potential impacts of the bored piling works. Nevertheless, it is important to conduct
the construction phase and post-construction phase monitoring on behaviour and movements of Chinese White Dolphin through land-based
theodolite tracking to confirm that they are not seriously affected by the
construction works if they are present.
5.3.2
Underwater Noise Monitoring
For the
underwater noise monitoring, the primary objectives were to measure and
characterize the following:
l
Baseline ambient noise levels during the
pre-construction phase of development; and
l
Industrial noise levels associated with bored piling
activities during the construction phase.
Detailed
methodology, results and discussion of the baseline underwater noise monitoring
which is undertaken before commencement of construction under the Contract is
presented in Annex H.
Key findings are presented below.
Survey
Location and Efforts
Thirty
days of underwater noise monitoring were conducted between 26 September and 25
October 2013 before commencement of construction of the Southern Connection
Viaduct Section. To characterize
the local soundscape, underwater sound data collection were conducted mostly in
the northeastern waters of Lantau
Island where bored piling activities in association with construction of the
Southern Connection Viaduct Section will occur. Sound measurements were made at various
distances from six bored piling sites along the TM-CLKL alignment (Figure 5.8) to allow estimation of a simple acoustic
propagation model for the region.
Key
Findings
A
total of 472 underwater acoustic recordings were available for the underwater
noise monitoring. After data
quality checking, 440 recordings were selected for subsequent noise analyses. The primary reason for data exclusion,
accounting for 32 recordings, were user-selected gain changes that occurred mid-recording and introduced high-frequency (10�V20
kHz) artifacts that could bias the acoustic results
with electronic noise.
The
selected data were analyzed in terms of both a
��wideband�� frequency range of 30 Hz to 40 kHz and a ��dolphin-sensitive��
frequency range of 400 Hz to 12.5 kHz. Mean bandlevel
across all recordings was 116.71 �� 6.29 dB re 1 �gPa for the wideband case and
112.27 �� 6.36 dB re 1 �gPa for the dolphin band case, where ���� x.xx�� refers to one standard deviation from the mean and
indicates the degree of variability in the measurements. According to observer logs and confirmed
in the acoustic records, vessel traffic is the greatest contributor to the
local soundscape. Bandlevels were not substantially affected by wind speed or
tidal height (tidal current), likely due to generally light winds and recording
system design, respectively.
Of
the 440 recordings analyzed, 122 recordings contained
dolphin vocalizations. Average bandlevel across these recordings was 118.44 �� 5.88 dB re 1
�gPa and 114.94 �� 5.26 dB re 1 �gPa for the wideband frequency range and dolphin
band, respectively (Figure 5.9). By comparison, recordings without dolphin
vocalizations (318 recordings) had average bandlevels
of 116.04 �� 6.34 dB re 1 �gPa and 111.24 �� 6.46 dB re 1 �gPa for wide and dolphin
frequency bands, respectively. Since
mean bandlevel was calculated across the entire
recording and the bandwidth as indicated, bandlevels
for the recordings containing dolphin vocalizations may not be representative
of received levels of individual dolphin vocalizations, and likely contain
other sound sources such as vessels and should thus be interpreted with
caution. However, the large sample
sizes and over 3 dB difference in average bandlevels, in particular in the dolphin band, suggest
that, when vocalizing, dolphins can contribute significantly to the soundscape.
Variability
of soundscape with time is observed with increased sound levels during daylight
hours (Figure 5.10). However, a bias might be present due to
the relatively small sample sizes outside daytime hours (n=82, as compared to
the sample size in daytime hours (n=358)), but increased sound levels during
daylight hours may also be attributed to increased vessel traffic, fishing,
construction, and other anthropogenic activity more likely to occur during the
day.
It
should be noted the development of an Event and Action Plan is not required
under the EM&A Manual for the underwater noise monitoring. However, results
obtained from this Study, in conjunction with the concurrent dolphin acoustic behavioural and land-based theodolite tracking studies, would
provide guidance with respect to mitigation for the resident dolphin population
during the impact monitoring phase.
5.3.3
Acoustic Behavioural
Monitoring
The primary
objective of the acoustic behavioural monitoring of
Chinese White Dolphins was to investigate their acoustic behaviour
in response to bored piling sites during both baseline and construction phases
of the Southern Connection Viaduct Section in order to understand whether any
observed differences in acoustic behaviour of
dolphins may represent a reaction to the bored piling works.
Detailed
methodology, results and discussion of the baseline acoustic behavioural monitoring which is undertaken before
commencement of construction under the Contract is presented in Annex H.
Key findings are presented below.
Survey
Location and Efforts
The acoustic behavioural monitoring was conducted concurrently with the
underwater noise monitoring between
26 September and 26 October 2013 before commencement of construction of the
Southern Connection Viaduct Section. The acoustic
behavioural monitoring was undertaken using both dipping hydrophone and passive
acoustic monitoring by ecological
acoustic recorders (EARs).
Acoustic
behavioural monitoring by dipping hydrophone was
undertaken mostly in the northeastern waters of Lantau Island where the bored piling activities will occur.
For this Study, the research vessel
followed a predefined route for systematic search effort in Northeast Lantau region to cover the area overlapped with the
alignment of the Southern
Connection Viaduct Section (Figure 5.11), where
dolphins will be potentially disturbed by the bored piling works during the
construction phase. The survey also
covered part of Northwest Lantau waters as control
sites, where dolphins were likely encountered for acoustic data collection but
would not be disturbed by the bored piling activities (eg
Sha Chau, Lung Kwu Chau and
Black Point).
For passive
acoustic monitoring, the EARs
were deployed at following two locations (Figure 5.11):
l
Within 500 m of the bridge alignment (Site C1); and
l A
control site between Sha Chau and Lung Kwu Chau (Site
C2), a less disturbed site relatively far away from the alignment of the Southern Connection Viaduct Section.
Key
Findings
Acoustic Behavioural Monitoring using Dipping Hydrophones
A total of 629
recording minutes were
made during the baseline acoustic monitoring period. Figure 5.12 shows the
number of recording minutes summed for each day, as well as the number of
sightings per day. Recordings were
obtained on all but 8 days of the 30-day period. The daily number of 5-minute recordings
ranged between 0 and 15 (mean = 4.4, stdv = 4.1) and
the daily number of minutes recorded was between 0 and 73.4 (mean = 21.0, stdv = 20.1). Whistling
and clicking rates were determined for all recordings (n =122). Figure 5.13 shows the
daily rate of click and whistle production recorded. The mean daily whistling
rate was 2.8 whistles/min (stdv = 3.9) and the mean
click production rate was 165.9 clicks/min (stdv =
100.0).
Findings from
the baseline acoustic behavioural monitoring using
dipping hydrophones indicate that acoustic activity of Chinese White Dolphins tended
to increase with group size and was highest during socializing periods. There was a gradual rise in the click
production rate throughout the day, peaking in the afternoon period between
14:00 and 15:59. This suggests that
the afternoon could be a time of increased foraging or socializing for dolphins
in this area. A large difference in
the occurrence of whistling was observed between Zones 1a (to the west of the
construction area) and 1b (including the construction area). This suggests that, at least during
daytime hours when the data were obtained, Zone 1a may be used differently than
Zone 1b by the dolphins. A
proportionately greater whistling rate in Zone 1b suggests more emphasis on
social behaviors. On the other
hand, clicking rates were equivalent between zones, suggesting that dolphin
vigilance and foraging effort may be similar in the two zones.
Summary of
data collected from the baseline acoustic behavioural
monitoring using dipping hydrophones is presented in Table 5.7.
Table 5.7 Values
of the two response variables of dolphin acoustic behaviour collected by
calibrated hydrophone (mean clicks and whistles per minutes) by size of group,
behavioural state and time of day during baseline period
|
|
Mean number of clicks per minute ( ��
s.d.)
|
Mean number of whistles per minute (
�� s.d.)
|
|
Group Size
|
|
|
|
1 dolphins
|
169.74 �� 194.88
(n=10)
|
2.89 �� 5.21 (n=10)
|
|
2-5 dolphins
|
161.46 �� 160.61
(n=86)
|
3.14 �� 6.54 (n=86)
|
|
6-9 dolphins
|
207.25 �� 157.17
(n=35)
|
5.64 �� 9.91 (n=35)
|
|
|
|
|
|
Behavioural State
|
|
|
|
Feeding
|
165.09 �� 118.49
(n=18)
|
2.71 �� 6.67 (n=18)
|
|
Milling
|
183.73 �� 182.09
(n=123)
|
3.83 �� 7.63 (n=123)
|
|
Socializing
|
294.63 �� 159.98
(n=4)
|
3.05 �� 3.33 (n=4)
|
|
Traveling
|
119.98 �� 81.82
(n=22)
|
4.98 �� 8.77 (n=22)
|
|
Time of day
|
|
|
|
08:00-09:59
|
100.83 �� 77.23 (n=5)
|
2.30 �� 4.35 (n=5)
|
|
10:00-11:59
|
155.65 �� 120.40
(n=35)
|
4.77 �� 9.59 (n=35)
|
|
12:00-13:59
|
171.08 �� 149.02
(n=52)
|
2.08 �� 5.08 (n=52)
|
|
14:00-15:59
|
218.49 �� 241.38
(n=27)
|
3.88 �� 5.77 (n=27)
|
|
16:00-17:59
|
186.40 �� 122.57
(n=11)
|
7.82 �� 11.83 (n=11)
|
Passive
Acoustic Monitoring by EARs
Dolphin
signals were detected on 26 out of 30 days of EAR recordings at C1 (Southern
Connection Viaduct Section alignment area). Figure 5.14 shows the
percentage of files for
each day (288 recordings per day) that contained dolphin signals. Daily dolphin acoustic activity was low,
with between 0% and 4.5% of recordings containing dolphin signals any given
day. Figure 5.15
shows the number of dolphin encounters and the mean duration of encounters for
each day of the deployment period. There
were a mean of 4.6 encounters per day (S.D. = 3.3) at site C1, which lasted a
mean of 1.9 min (S.D. = 3.6).
Dolphin
signals were detected on all 30 days of EAR recordings at Site C2 (control site
near Lung Kwu Chau). Figure 5.16 shows the
percentage of files for each day (288 recordings per day) that contained
dolphin signals. Daily dolphin acoustic activity was variable, with between ~1%
and 28% or recordings containing dolphin signals any given day. Figure 5.17 shows the
number of dolphin encounters and the mean duration of encounters for each day
of the deployment period. There
were a mean of 8.6 encounters per day (S.D. = 2.0) at site C2, which lasted a
mean of 25.0 min (S.D. = 14.3).
The EAR data
indicate that dolphin acoustic activity is considerably greater at site C2 (control
site near Lung Kwu Chau) than at site C1 (Southern
Connection Viaduct Section alignment area). Dolphin detections at site C1 did not
exhibit any temporal pattern of dolphin occurrence. At site C2, the main temporal features
were the peak in detections occurring in the morning hours between 08:00 and
9:59, followed by a comparative lull in the mid-day hours between 11:00 and
13:59. The difference in both
detection rates and temporal occurrence suggest that dolphins use sites C1 and
C2 very differently. The lack of
whistles recorded and the sparse detections at Site C1 is an indicator that the
area is likely not used very much for socializing or regular foraging.
Event
Action Plan
According to Section 6.5 of the EM&A Manual, the
Action and Limit Levels as well as the Event Action Plan for ecology should be
proposed using the baseline monitoring data. More specifically, as described in Table 6.9 of the EM&A Manual, the Event
Action Plan should be triggered when dolphin numbers and behaviour
patterns recorded in the construction and post-construction monitoring are
significantly lower or different than those recorded in the pre-construction
monitoring. Therefore, an Event and
Action Plan should be developed to examine changes in the dolphin acoustic behaviour between baseline and impact phases of monitoring.
To develop the
Event and Action Plan (EAP) on dolphin acoustic behaviour,
it is proposed to take into account of the values of two response variables
(clicking and whistling rates) as a function of the size of dolphin group,
their behavioural state and time of day deduced from
the calibrated hydrophone data as presented in Table 5.7. Departures
of any of these variables between baseline and construction phases with a 20%
difference will be of concern and should trigger the Action Level under the Event
Action Plan. If a 40% difference in
any of these variables between baseline and construction phases is detected,
then the Limit Level under the Event Action Plan should be triggered and
immediate actions will be required. The Action and Limit Levels of these
variables are presented in Table 5.8.
In addition,
the response variable for the EAR data should be the diel
occurrence at the two sites (ie Impact Site C1 and Control
Site C2). However, there was no
distinct diel pattern in acoustic activity of
dolphins at Site C1 and there was only a weak diel
pattern observed at Site C2. As
there was no distinct peak occurrence of dolphins at Site C1, the shift of peak
occurrence in acoustic signal detection cannot be used as triggering mechanism
for the Event and Action Plan. Alternatively, it is proposed that if there is a
20% difference in detections occurred during the nighttime
period between 19:00 and 6:59 at Site C1 (baseline percentage of detection as
54%) in the impact phase monitoring period (i.e. ≥74% or ≤34% of all detections
occurred at nighttime), then the Action Level should
be triggered. On the other hand, if
there is a 40% difference in detections occurred during the nighttime
period between 19:00 and 6:59 at Site C1 in the impact phase monitoring period
(i.e. ≥94% or ≤14% of all detections occurred at nighttime),
then the Limit Level should be triggered.
However, if such 20% or 40% difference occurs at both Sites C1 and C2
(baseline percentages of detections as 54% and 53% respectively), the action or
limit level should not be triggered, as the change in diel
pattern of dolphin occurrence does not only occur at the site of impact (C1)
but also at the control site (C2), and the changes in dolphin occurrence at
both sites may not be directly to the TM-CLKL construction works. Such review of data from Site C2
(control site between Lung Kwu Chau and Sha Chau)
should be part of the review as listed in Action #2 by the ET Leader when the
AL or LL is triggered as detailed in the Action and Event Plan (Table 5.9).
Table 5.8 Action
Level (AL) and Limit Level (LL) for all response variables by size of group,
behavioural state and time of day
|
|
Mean no. of clicks per minute
|
Mean no. of whistles per minute
|
|
Group Size
|
AL / LL
|
AL / LL
|
|
1 dolphins (20%/40% lower)
|
135.79 / 101.84
|
2.31 / 1.73
|
|
1 dolphins (20%/40% higher)
|
203.69 / 237.64
|
3.47 / 4.05
|
|
2-5 dolphins (20%/40% lower)
|
129.17 / 96.88
|
2.51 / 1.88
|
|
2-5 dolphins (20%/40% higher)
|
193.75 / 226.04
|
3.77 / 4.40
|
|
6-9 dolphins (20%/40% lower)
|
165.80 / 124.35
|
4.51 / 3.38
|
|
6-9 dolphins (20%/40% higher)
|
248.70 / 290.15
|
6.77 / 7.90
|
|
|
|
|
|
Behavioural State
|
AL / LL
|
AL / LL
|
|
Feeding (20%/40% lower)
|
132.07 / 99.05
|
2.17 / 1.63
|
|
Feeding (20%/40% higher)
|
198.11 / 231.13
|
3.25 / 3.79
|
|
Milling (20%/40% lower)
|
146.98 / 110.24
|
3.06 / 2.30
|
|
Milling (20%/40% higher)
|
220.48 / 257.22
|
4.60 / 5.36
|
|
Socializing (20%/40% lower)
|
235.70 / 176.78
|
2.44 / 1.83
|
|
Socializing (20%/40% higher)
|
353.56 / 412.48
|
3.66 / 4.27
|
|
Traveling (20%/40% lower)
|
95.98 / 71.99
|
3.98 / 2.99
|
|
Traveling (20%/40% higher)
|
143.98 / 167.97
|
5.98 / 6.97
|
|
|
|
|
|
Time of day
|
AL / LL
|
AL / LL
|
|
08:00-09:59 (20%/40% lower)
|
80.66 / 60.50
|
1.84 / 1.38
|
|
08:00-09:59 (20%/40% higher)
|
121.00 / 141.16
|
2.76 / 3.22
|
|
10:00-11:59 (20%/40% lower)
|
124.52 / 93.39
|
3.82 / 2.86
|
|
10:00-11:59 (20%/40% higher)
|
186.78 / 217.91
|
5.72 / 6.68
|
|
12:00-13:59 (20%/40% lower)
|
136.86 / 102.65
|
1.66 / 1.25
|
|
12:00-13:59 (20%/40% higher)
|
205.30 / 239.51
|
2.50 / 2.91
|
|
14:00-15:59 (20%/40% lower)
|
174.79 / 131.09
|
3.10 / 2.33
|
|
14:00-15:59 (20%/40% higher)
|
262.19 / 305.89
|
4.66 / 5.43
|
|
16:00-17:59 (20%/40% lower)
|
149.12 / 111.84
|
6.26 / 4.69
|
|
16:00-17:59 (20%/40% higher)
|
223.68 / 260.96
|
9.38 / 10.95
|
Table 5.9 Event
and Action Plan on Dolphin Acoustic Behaviour
|
EVENT
|
ACTION
|
|
ET
Leader
|
IEC
|
SO
|
Contractor
|
|
Action Level
With the numerical values presented in Table 5.7, when any of the response
variable for dolphin acoustic behaviour recorded in the construction phase
monitoring is 20% lower or higher than that recorded in the baseline
monitoring (see Table5.8), or when
there is a difference of 20% in dolphin acoustic signal detection at nighttime period at Site C1 only, the action level should
be triggered
|
1.
Repeat statistical data analysis to confirm findings;
2.
Review all available and relevant data to ascertain if differences are as a
result of natural variation or seasonal differences;
3. Identify
source(s) of impact;
4.
Inform the IEC, SO and Contractor;
5. Check
monitoring data;
6. Carry
out audit to ensure all dolphin protective measures are implemented fully and
additional measures be proposed if necessary
|
1. Check
monitoring data submitted by ET and Contractor;
2.
Discuss monitoring with the ET and the Contractor;
|
1.
Discuss with the IEC the repeat monitoring and any other measures proposed by
the ET;
2. Make
agreement on measures to be implemented.
|
1. Inform
the SO and confirm notification of the non- compliance in writing;
2.
Discuss with the ET and the IEC and propose measures to the IEC and the SO;
3.
Implement the agreed measures.
|
|
Limit Level
With the numerical values presented in Table 5.7,
when any of the response variable for dolphin acoustic behaviour recorded in
the construction phase monitoring is 40% lower or higher than that recorded
in the baseline monitoring (see Table 5.8), or when there is a difference of
40% in dolphin acoustic signal detection at nighttime
at Site C1 only, the limit level should be triggered
|
1.
Repeat statistical data analysis to confirm findings;
2.
Review all available and relevant data to ascertain if differences are as a
result of natural variation or seasonal differences;
3.
Identify source(s) of impact;
4.
Inform the IEC, SO and Contractor;
5. Check
monitoring data;
6. Carry
out audit to ensure all dolphin protective measures are implemented fully and
additional measures be proposed if necessary
7.
Discuss additional dolphin monitoring and any other potential mitigation
measures (eg consider to temporarily stop relevant
portion of construction activity) with the IEC and Contractor.
|
1. Check
monitoring data submitted by ET and Contractor;
2.
Discuss monitoring with the ET and the Contractor;
3.
Review proposals for additional monitoring and any other measures submitted
by the Contractor and advise ER accordingly.
|
1.
Discuss with the IEC the repeat monitoring and any other measures proposed by
the ET;
2. Make
agreement on measures to be implemented.
|
1.
Inform the SO and confirm notification of the non- compliance in writing;
2.
Discuss with the ET and the IEC and propose measures to the IEC and the SO;
3.
Implement the agreed measures.
|
Abbreviations: ET �V Environmental Team,
IEC �V Independent Environmental Checker, SO �V Supervising Office
6
Conclusion
In accordance with the EM&A Manual of the TM-CLKL Project, baseline
monitoring has been undertaken prior to commencement of the construction works
of the Contract for the following baseline monitoring components:
Ÿ Air Quality;
Ÿ Noise;
Ÿ Water Quality; and
Ÿ Ecology (including baseline
walk-over survey, baseline dolphin monitoring and baseline bored piling
monitoring).
The baseline
air quality monitoring was conducted at two (2) monitoring locations (ASR9A and
ASR9C �V Siu Ho Wan MTRC Depot) between 18 and 31 October 2011. Overall, the baseline air
quality monitoring results are considered representative to the ambient air
quality conditions of the respective sensitive receivers. The Action and Limit Levels for air
quality (ie for 1-hour and 24-hour TSP
levels) were established based on the baseline monitoring results.
Baseline noise monitoring was conducted at the designated monitoring
station NSR1 at Pak Mong Village between 18 October
and 1 November 2011. The major noise sources
identified at the monitoring station are the noise from insect and bird
calling. The baseline monitoring
results are considered representative of the ambient noise level.
Baseline water quality
monitoring was conducted at seven (7) monitoring stations (IS(Mf)9,
IS(Mf)16, IS8, SR4, SR4a, CS(Mf)3 and CS(Mf)5) between 6 and 31 October 2011,
except for monitoring at station SR4a which was conducted between 29 August and
24 September 2013. No observable
pollution source was recorded at the monitoring stations and the baseline
monitoring results are thus considered representative of the ambient water quality
levels. Action and Limit Levels
were established for DO, SS and turbidity based on the baseline monitoring results.
Baseline walk-over survey was conducted on 13
and 24 September 2013 with ten (10) different types of habitats observed in the
Study area. Overall, there appeared
to be no significant changes in conditions of habitats within the Study area.
Baseline Chinese White
Dolphin monitoring was conducted in two survey areas (Northeast Lantau and Northwest Lantau) from
September to November 2011. Dolphin
sightings, distribution, encounter rate, group size, habitat use, mother-calf
pairs and behavior were reported.
Photo-identification and range estimation of identified individuals were
also made. Action and Limit Levels
are established based on the dolphin encounter rate with due consideration on
seasonal variation in dolphin abundance.
Baseline bored piling monitoring comprising land-based
theodolite tracking, underwater noise monitoring and acoustic behavioural monitoring were conducted between September and
October 2013 before commencement of construction of the Contract. Action and Limit Levels as well as the Event
Action Plan are established based on the baseline monitoring data obtained from
the dolphin acoustic behaviour monitoring.